I assume you have read my first post on the profiler so i believe you know where the profiler windows is. If you don't then read the earlier post on NetBeans Profiler
Now lets get more familiar with the profiler window...
Controls

Depending on the version you are using some buttons might not be there.
The first control when clicked runs the last profiling command again.
The stop button next to it stops the profiling sessions.
Next button resets the results buffer.
The trash can button runs the garbage collector (GC).
The control next to it is useful when you want modify a profiling session.
The last button opens the VM (virtual machine) Telemetry overview window.
Results Section
The first button “take snapshot” captures the profiling information on the fly.
The “live Result” button retrieves current profiling information and opens it in the source editor window.
If you don't need the results already accumulated the button below those two does the job.
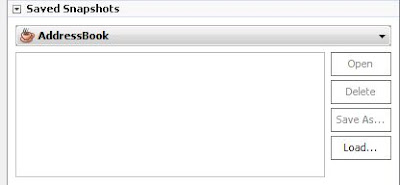
Snapshots

View and Basic Telemetry
The VM Telemetry button opens the a window displaying data on the inner process of the java virtual machine.
The thread button opens a window in the editor displaying thread activities of the on going profiling session. [ only works if thread monitoring is enabled ]
The basic telemetry view provides a quality data on the profiling tasks..
You are now familiar with the profiling window... now lets get straight to business
Profiling a class or a project
Generally, to profile any project be it main or not, right-click on the project folder in the project window and select the “profile project” option
on clicking the above option this dialog pops up
The options are yours to select, you can either profile the whole application or part of it.
if you want profile just part of the application, as soon as you select it you'd be given additional options to edit or select the classes you want to profile. Click the “Run” button when you are done... NetBeans profiler does the rest.
You should notice that most of the buttons in the profiler window is enabled ..
To attach a profiler to a running application all you have to do is select "profile" from the main menu and then select "attach Profiler" options.
The attach profiler dialog should appear... its the same as the one above but with an attach button instead of a run button.
select your options and click the attach button to run the attach wizard.. here is
select “application” in the target field, leaving the other fields in their default unless you are running it remotely. click next to continue. click next again and finally click finish to start profiling. The progress bar should appear..
wait till it finishes and you are ready to monitor you selected options.
Note
when you want profile a project for the first time, you would probably see this dialog
just click Ok and continue.
Now lets explore the run/attach profiler dialog...
click on the CPU button on the left pane to select options to analyze the cpu performance
click on the monitor button if you intend to monitor thread activities....
click on the memory if you intend to keep an eye on memory usage and garbage collection.
Each of these controls when clicked gives an option to create custom settings.
Now that we know the basics of the profiler, I will end here...
We will delve deeper on my next post.....
keep exploring......


No comments:
Post a Comment